Learn about Core Web Vitals in plain English. Understand LCP, INP & CLS, why they matter for SEO, and how to improve them with step-by-step fixes.
Introduction: Why page experience signals Matter for SEO and UX
Think about walking into a store. The lights should come on right away (loading), the cashier should greet you when you step up (interactivity), and the floor shouldn’t shift under your feet while you browse (stability). Online, these same expectations define how users judge your website. Google built Core Web Vitals to measure exactly that: how fast a page loads, how quickly it responds, and whether it stays steady while people use it.
These aren’t just technical numbers. These metrics directly influence your Google rankings, bounce rates, and conversions. A slow, unresponsive, or jumpy site frustrates visitors and can cost you sales. By contrast, a smooth experience signals professionalism, builds trust, and encourages users to stick around.
The three pillars are:
- Largest Contentful Paint (LCP): How fast meaningful content appears.
- Interaction to Next Paint (INP): How quickly the page reacts when users click or type.
- Cumulative Layout Shift (CLS): Whether the layout stays stable as it loads.
We’ll break down each one in plain English, show you how to measure them, and provide practical fixes. If you want to dive deeper as you read, each section has links to help you go further.
By the end of this guide, you’ll understand not just the acronyms, but the business impact — and you’ll know what to do next to improve your own site.
Table of Contents
What Are Core Web Vitals?
Core Web Vitals are Google’s way of measuring how people actually experience your site. They don’t just look at abstract “speed scores” — they focus on the parts of performance that matter most to users: loading, responsiveness, and stability.
Here’s a plain-English breakdown of the three metrics:
- Largest Contentful Paint (LCP): How long it takes for the main content (like a hero image or headline) to appear on screen.
- Interaction to Next Paint (INP): How quickly the site responds when someone clicks, taps, or types.
- Cumulative Layout Shift (CLS): Whether the layout stays steady, or if elements like ads and buttons jump around.
Unlocking Success with 3 Core Web Vitals: LCP, INP & CLS is a guide that breaks down Google’s Core Web Vitals, which measure the crucial user experience aspects of loading, responsiveness, and stability. Rooted in web performance fundamentals, this guide provides practical insights on how to understand, measure, and improve these metrics to enhance your site’s performance. With clear explanations and actionable tips, you’ll be equipped to optimize your website for better user engagement and business outcomes.
How Core Web Vitals Differ From Generic “Speed Scores”
Many site owners are familiar with overall scores from tools like GTmetrix or Pingdom, but those can be misleading. A page might score well in a synthetic test and still feel sluggish or unstable to real users. Google’s page experience metrics cut through that by measuring what visitors actually experience in the browser.
In other words, instead of “how fast does the lab say it is,” Google looks at “how usable is this site for real people?” That’s why these metrics are so important for both user experience and SEO.
How to Get Started With Testing
Improving critical site performance measures begins with measuring them. Luckily, Google provides free tools:
- PageSpeed Insights: Run your URL through PageSpeed Insights to get a snapshot of both “lab” (synthetic) and “field” (real user) data.
- Chrome UX Report (CrUX): Check how your site performs for actual Chrome users in the wild at CrUX.
- Lighthouse in DevTools: Open Chrome, right-click → “Inspect” → Lighthouse tab. Generate a report to see where your site is struggling.
For more practical ideas on where to begin, see 9 Optimization Tips to Pass Core Web Vitals Assessment.
Largest Contentful Paint (LCP): Loading Performance

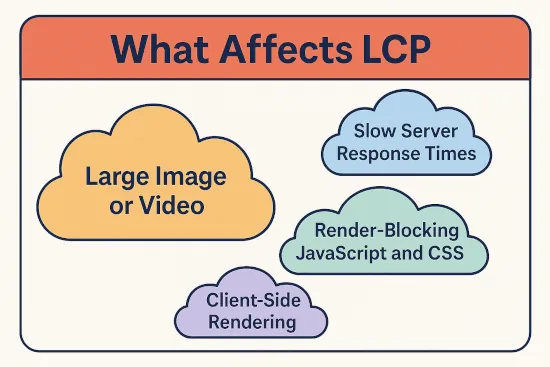
Think of LCP as answering the question: “How fast does the main stuff show up?” When someone visits your site, the largest visible element — usually a hero image, background banner, or H1 heading — should appear quickly. If it lags, visitors feel like the page is slow, even if smaller items load first.
Benchmarks:
- Good: ≤ 2.5 seconds
- Needs improvement: 2.5–4 seconds
- Poor: > 4 seconds
How to Audit LCP
- PageSpeed Insights (PSI): Run your page in PageSpeed Insights. In the Opportunities/Diagnostics sections, find the element flagged as LCP and whether it’s an image or text block.
- Chrome DevTools Performance: Open DevTools → Performance → record a load. Hover the LCP marker to see the target element and its render time.
- Network + Coverage: In DevTools, check Network waterfalls for slow first byte (TTFB) or large assets, and Coverage for unused CSS/JS that blocks rendering.
- Field data sanity check: If available, compare PSI’s “Origin/URL field data” (CrUX) to ensure your lab findings match real-user experience.
How to Improve LCP
1) Optimize the LCP element (usually an image or a large text block)
Serve modern formats + responsive sizes
<img
  src="/images/hero-800.webp"
  srcset="/images/hero-400.webp 400w, /images/hero-800.webp 800w, /images/hero-1600.webp 1600w"
  sizes="(max-width: 800px) 100vw, 800px"
  fetchpriority="high"
alt="Hero image description">- Prefer WebP or AVIF.
- Provide accurate
width/height(also helps CLS). - Do not lazy-load the LCP image. Keep
loading="lazy"for below-the-fold media.
Preload the hero image
<link rel="preload" as="image" href="/images/hero-1600.webp"
  imagesrcset="/images/hero-800.webp 800w, /images/hero-1600.webp 1600w"
  imagesizes="100vw"
  fetchpriority="high">
If LCP is text:
- Avoid render-blocking CSS by inlining critical CSS for above-the-fold content.
- Use
font-display: swapto prevent invisible text; consider preloading the primary text font:<link rel="preload" href="/fonts/Inter-Variable.woff2" as="font" type="font/woff2" crossorigin>
2) Shorten the critical path
- Preconnect / DNS Prefetch to critical domains:
<link rel="preconnect" href="https://cdn.example.com" crossorigin>
<link rel="dns-prefetch" href="//cdn.example.com"> - Defer non-critical CSS/JS
<link rel="preload" as="style" href="/css/noncritical.css" onload="this.rel='stylesheet'">
<noscript><link rel="stylesheet" href="/css/noncritical.css"></noscript>

<script src="/js/noncritical.js" defer></script> - Eliminate long main-thread tasks: split bundles, remove unused libraries, and tree-shake.
3) Improve TTFB (server + CDN)
- Caching layers: enable full-page caching (WordPress: page cache + object cache), and edge cache HTML for high-traffic pages.
- Compression & protocols: use Brotli (or GZIP fallback), and ensure HTTP/2 or HTTP/3 is enabled.
- CDN: serve images/CSS/JS from a global CDN. Image CDNs (e.g., on-the-fly resizing, WebP/AVIF conversion) reduce bytes and processing time.
- Database performance: optimize slow queries, tune your database configuration, reduce autoloaded options, and keep PHP/DB versions current.
4) WordPress-specific quick wins
- Preload the hero with a hook
// functions.php
add_action('wp_head', function () {
    echo '<link rel="preload" as="image" href="' .
         esc_url( get_theme_file_uri('/assets/hero-1600.webp') ) .
         '" fetchpriority="high">';
}); - Add preconnect to CDN
add_filter('wp_resource_hints', function($hints, $relation){
    if ($relation === 'preconnect') {
        $hints[] = 'https://cdn.example.com';
    }
    return $hints;
}, 10, 2); - Avoid lazy-loading the LCP image: if WordPress auto-adds it, remove for the hero only (e.g., render the hero with a template part that omits
loading="lazy").
Advanced Tactics (when basics aren’t enough)
- Critical CSS tooling: generate route-level critical CSS and inline only what’s required for above-the-fold content.
- HTTP push alternatives: use preload hints (push is deprecated in many stacks).
- Predictive prefetching: prefetch likely next pages on idle (
<link rel="prefetch" href="/pricing" as="document" crossorigin>) to speed subsequent LCPs. - Image placeholders: use blur-up (aka LQIP) or solid-color placeholders that are tiny and swapped instantly when the full image arrives.
Recap
LCP is about how fast meaningful content becomes visible. Optimize the LCP element (often the hero), trim the critical path, improve TTFB with caching/CDN, and keep non-critical assets out of the way. Aim for ≤ 2.5 s on mobile.
For a complete checklist of fixes, see Largest Contentful Paint failed? The ultimate 2024 checklist to fix it.
Interaction to Next Paint (INP): Responsiveness

INP is Google’s newer responsiveness metric, replacing First Input Delay (FID). It measures: “How quickly does the page respond after I click, tap, or type?”
If a button takes half a second or more to react, users feel friction — even if the site looks visually loaded. INP captures that frustration better than older metrics.
Benchmarks:
- Good: ≤ 200 ms
- Needs improvement: 200–500 ms
- Poor: > 500 ms
How to Audit INP
- PageSpeed Insights (PSI): Run your URL in PageSpeed Insights. Scroll to Diagnostics → Avoid long main-thread tasks. Long tasks are common causes of poor INP.
- Chrome DevTools Performance: Open DevTools → Performance, record an interaction, then locate the long tasks in the flame chart.
- Web Vitals Chrome Extension: Install the Web Vitals extension to monitor INP during real browsing.
- Field data check: If available, review CrUX field data for your domain to confirm whether INP issues appear in the wild.
How to Improve INP
1) Break up long tasks
Avoid JavaScript functions that block the main thread for hundreds of ms. Split heavy loops into async chunks:
// Bad: blocks for ~500ms
heavyLoop();

// Good: break into smaller chunks
setTimeout(heavyLoopChunk, 0);
2) Optimize event handlers
- Keep
onclick,oninput, and other handlers lightweight. - Defer analytics or tracking until after the main UI update.
- Use passive listeners for scroll/touch events:
window.addEventListener('scroll', onScroll, { passive: true });
3) Reduce JavaScript execution
- Remove unused libraries and plugins.
- Bundle and tree-shake ES modules.
- Load non-critical scripts with
deferorasync.
<script src="/js/analytics.js" defer></script>
<script src="/js/widget.js" async></script>
4) Use web workers for heavy computation
Move background work off the main thread:
const worker = new Worker("worker.js");
worker.postMessage(data);
worker.onmessage = (e) => {
  console.log("Result:", e.data);
};
5) Monitor real interactions
- Use Lighthouse Timespan mode to measure responsiveness during manual interaction.
- Set up Real User Monitoring (RUM) to catch field INP values.
Advanced Fixes
- Batch DOM updates: Instead of modifying the DOM in many small steps, group changes into a single reflow.
- Virtualize long lists: Render only visible items with tools like React Window or Intersection Observer.
- Idle callbacks: Use
requestIdleCallbackto schedule non-urgent tasks without blocking user interactions.
requestIdleCallback(() => {
  // Low-priority analytics or prefetching
});
Recap
INP reflects how responsive your site feels. Break up long tasks, slim down JavaScript, optimize event handlers, and use workers when needed. Aim for ≤ 200 ms so clicks, taps, and typing always feel instant.
For deeper strategies, see Web Performance Experts Guide to Mastering Interaction to Next Paint (INP).
Cumulative Layout Shift (CLS): Visual Stability

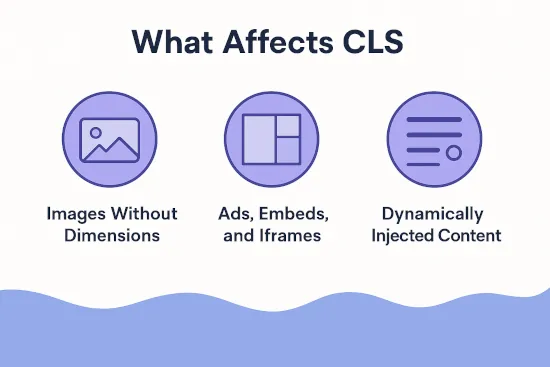
CLS measures how much visible content shifts unexpectedly while the page is loading. It captures the annoyance of buttons jumping, ads pushing content down, or images resizing without warning. Even if a page loads quickly, unstable layouts can destroy user trust and cause misclicks.
Benchmarks:
- Good: ≤ 0.1
- Needs improvement: 0.1–0.25
- Poor: > 0.25
How to Audit CLS
- Lighthouse in Chrome DevTools: Run an audit and review screenshots highlighting layout shifts.
- Performance tab in DevTools: Enable “Layout Shift Regions.” Purple boxes will highlight shifting elements as the page loads.
- Web Vitals extension: Install the Chrome extension to spot CLS in real time.
- Field data: Use CrUX or RUM to verify whether layout shifts affect real users.
How to Improve CLS
1) Always define dimensions
Reserve space for images, videos, and embeds:
<img src="photo.jpg" width="600" height="400" alt="Sample">
2) Reserve ad slots
.ad-slot {
  width: 300px;
  height: 250px;
  background: #f0f0f0;
}
3) Preload fonts to avoid FOIT/FOUT
<link rel="preload" href="/fonts/Inter.woff2" as="font" type="font/woff2" crossorigin>
4) Append content below, not above
Avoid inserting DOM nodes above existing content. Use skeleton loaders for late-arriving content.
5) Use transform/opacity for animations
Only animate with transform or opacity — never top, left, or height, which trigger layout shifts.
Advanced Fixes
- Ad tech handling: If using a third-party ad network, configure slot sizes in advance and collapse only empty slots.
- Dynamic content placeholders: Reserve boxes for related-articles widgets, chat popups, or personalized recommendations.
- Font-display strategies: Use
font-display: optionalorswapto minimize reflow when fonts load late. - Lazy loading with care: Reserve fixed dimensions for lazy-loaded images and iframes.
Recap
CLS measures how stable your layout feels as the page loads. Prevent content shifts by defining dimensions, reserving slots, preloading fonts, and animating only with transform/opacity. Aim for a score of ≤ 0.1 for a smooth, trustworthy experience.
For more guidance, see Comparing e-commerce platforms with Google’s real UX data.
Supporting Metrics: TTFB, TTI and TBT
While LCP, INP, and CLS are Google’s page experience metrics, three additional measurements often appear in audits: Time to First Byte (TTFB), Time to Interactive (TTI), and Total Blocking Time (TBT). These aren’t direct ranking factors, but they strongly influence user experience and correlate with responsiveness problems.
Time to First Byte (TTFB)
TTFB measures how quickly the server responds to the initial request. In plain English: “How long before the first piece of data arrives?” A slow TTFB means the browser is waiting on the server before it can even begin rendering.
Causes of slow TTFB:
- High server load or weak hosting resources
- Slow database queries or unoptimized backend code
- No caching or inefficient caching strategy
- Geographical distance from the user to the origin server
How to improve TTFB:
- Enable full-page caching: Store rendered HTML to serve instantly. (WordPress: use page + object caching.)
- Use a CDN: Deliver cached pages and assets from edge servers closer to visitors.
- Optimize the backend: Tune database queries, reduce unnecessary autoloaded options, and upgrade PHP or Node.js versions.
- Leverage modern protocols: Ensure HTTP/2 or HTTP/3 is enabled.
- Measure continuously: Tools like WebPageTest or PageSpeed Insights highlight TTFB in the waterfall view.
Time to Interactive (TTI)
TTI measures when a page becomes fully usable — not just visually complete, but also responsive to input. If scripts keep running after the main content is visible, TTI will be delayed.
How to improve TTI:
- Code splitting: Load only what’s needed for the first screen.
- Defer non-critical JavaScript: Use
asyncordefer. - Inline critical CSS: Prevent render-blocking CSS.
- Reduce main-thread work: Profile with Chrome DevTools → Performance.
Total Blocking Time (TBT)
TBT measures the total time JavaScript keeps the main thread blocked between First Contentful Paint and TTI. Long blocking tasks correlate closely with poor INP.
How to improve TBT:
- Audit third-party scripts: Remove or delay anything non-essential.
- Break up long tasks: Use async patterns and web workers.
- Tree-shake bundles: Eliminate unused JS and CSS.
- Lazy-load non-critical widgets: Chatbots, carousels, or ads should load after the core content.
// Example: splitting a blocking task
function processBigData(data) {
  const chunkSize = 500;
  let i = 0;
  function processChunk() {
    const end = Math.min(i + chunkSize, data.length);
    while (i < end) {
      heavyComputation(data[i]);
      i++;
    }
    if (i < data.length) {
      setTimeout(processChunk, 0);
    }
  }
  processChunk();
}
Trade-offs and Strategy
Optimizing TTFB, TTI, and TBT requires balance. Removing scripts may improve metrics but hurt functionality. The goal is to prioritize responsiveness: load only what users need to see and act on first, while deferring everything else.
- Analytics and tracking: Delay until after page interaction.
- Third-party widgets: Load on interaction, not on initial page load.
- Core scripts: Keep them lean and fast.
- Caching + CDN: Reduce server wait time to improve TTFB across all pages.
Recap
TTFB, TTI, and TBT aren’t official Core Web Vitals, but they are leading indicators of responsiveness and server health. Reducing blocking scripts, splitting code, optimizing caching, and deferring non-essential work improves all three metrics — and indirectly boosts LCP and INP.
For more detail, see:
- How to Reduce Time to First Byte (TTFB)
- What is Time To Interactive and How to Get a Good TTI Score?
- What is Total Blocking Time and How to Reduce Your TBT Score?
Business Justification: Why these metrics Matter for ROI
Improving the vitals isn’t just about pleasing Google — it’s about protecting revenue, reducing churn, and building trust with users. A fast, stable, and responsive website directly impacts conversions and long-term business outcomes.
The SEO Advantage
The LCP, INP, and CLS metrics are confirmed Google ranking factors. Sites that load faster and remain stable often rank above slower competitors. Even small improvements can compound organic traffic gains, which lowers acquisition costs compared to paid ads.
Conversion Rate Uplift
Performance directly correlates with conversions. Faster, smoother pages reduce friction in checkout, sign‑up, and donation flows.
- Retail: Every 100 ms delay can lower conversion rates by 1%.
- SaaS: Faster dashboards reduce perceived complexity, increasing trial-to-paid upgrades.
- Non-profits: Stable donation pages improve completion rates by reducing user frustration.
Competitive Benchmarking
Core Web Vitals are public. Tools like CrUX Vis or WebPageTest let you compare your site’s UX against competitors. If your pages load in 2.0s and theirs take 3.5s, you have a measurable marketing advantage.
Talking Points for Executives
- Direct ranking impact: Faster sites perform better in organic search.
- Revenue upside: Reduced abandonment leads to more completed transactions.
- User trust: A professional, stable experience improves brand perception.
- Cost savings: Optimized sites use less bandwidth and server capacity.
Recap
Core Web Vitals are more than technical benchmarks — they are business levers. Improvements generate SEO wins, conversion lifts, and stronger customer loyalty.
For a deeper dive into the revenue connection, see Why Site Speed Is the New Black Friday Strategy.
Troubleshooting these metrics
Even after applying best practices, some sites still struggle to pass the vitals. Troubleshooting means digging deeper into root causes and avoiding common mistakes.
Common Pitfalls
Lazy-loading the LCP image
WordPress and some plugins applyloading="lazy"to all images by default, including the hero. This delays the Largest Contentful Paint. Manually exclude the main image from lazy loading.Adding too many third-party scripts
Marketing tags, chat widgets, and analytics can block rendering and delay INP. Offload them with workers or load them after interaction.Ignoring mobile performance
Many sites optimize for desktop but fail key web performance metrics on mobile networks. Always test on mid-range devices and throttled 4G.Unoptimized fonts
Missing preload hints or poor font-display strategies cause invisible text and CLS shifts.Complex JavaScript frameworks
SPAs often load large bundles that delay interactivity. Use code splitting, hydration strategies, and server-side rendering to mitigate.
What to Do if Fixes Don’t Work
- Audit again with multiple tools: Compare PageSpeed Insights, Lighthouse, and WebPageTest to ensure the issue is real and not tool-specific.
- Check field vs. lab data: Field data (CrUX, RUM) might differ from synthetic results. A site may pass in lab tests but fail with real users due to ads, extensions, or network variance.
- Profile long tasks: Use Chrome DevTools → Performance to identify which scripts or functions are blocking.
- Experiment in staging: Disable non-essential plugins or scripts one by one to isolate the culprit.
- Iterate incrementally: Fix one issue at a time and re-test, instead of making sweeping changes.
Recap
Troubleshooting Core Web Vitals is about isolating the bottleneck. Avoid lazy-loading the hero image, watch your script weight, optimize for mobile, and profile long tasks. When in doubt, validate fixes against real-user data to confirm impact.
For additional perspective, see Your Web Performance Is Too Reactive; It’s Time to Do More Than Put Out Fires.
Quick Fixes Checklist
While full optimization takes planning, there are quick wins that can dramatically improve these metrics without a full rebuild. These fixes target the most common issues.
For LCP (Loading)
- Compress and convert hero images to WebP or AVIF.
- Preload the main hero image and critical CSS.
- Use a CDN to serve static assets closer to users.
- Enable server caching and Brotli/GZIP compression.
For INP (Responsiveness)
- Break up long JavaScript tasks into smaller chunks.
- Defer analytics and tracking scripts until after interaction.
- Remove unused libraries and plugins.
- Move heavy work to a web worker.
For CLS (Stability)
- Always define
widthandheightfor images and videos. - Reserve space for ad slots and embeds.
- Preload fonts to prevent reflow during load.
- Animate only with
transformandopacity.
For TTFB, TTI & TBT (Supporting Metrics)
- TTFB: Enable caching layers, optimize database queries, and use a CDN to serve content closer to users.
- TTI: Code split large bundles, inline critical CSS, and defer non-critical JavaScript.
- TBT: Break up long tasks, reduce third-party script usage, and lazy-load non-critical widgets.
Recap
These quick fixes won’t solve every issue, but they address the most common Core Web Vitals failures in minutes. By optimizing images, streamlining JavaScript, reserving space for dynamic elements, and deferring third-party scripts, you’ll see measurable improvements fast.
For more techniques, see Partytown: Optimize Third Party Scripts with Web Workers.
Conclusion
These aren’t abstract metrics — they represent real frustrations your users feel. A slow-loading hero image, an unresponsive button, or a page that jumps mid-click are the online equivalents of a dark store, an absent cashier, or a wobbly floor.
- LCP shows how fast users can start consuming meaningful content.
- INP measures how quickly the site responds to their input.
- CLS ensures the layout stays stable while loading.
Improving these metrics delivers more than SEO gains. It creates a smoother user experience, strengthens trust, reduces bounce rates, and boosts conversions. Businesses that prioritize performance see measurable ROI — from higher search visibility to improved customer satisfaction.
The key is continuous monitoring. Core Web Vitals change as sites evolve, ads rotate, and scripts are added. Regular audits with PageSpeed Insights, Lighthouse, and Real User Monitoring ensure that your improvements last.
Unlock the secrets to success with core web vitals LCP, INP, and CLS. These metrics impact user experience directly, so optimizing them is crucial. Remember, your users are affected by slow-loading content and unresponsive features, so make sure to prioritize performance for better results.