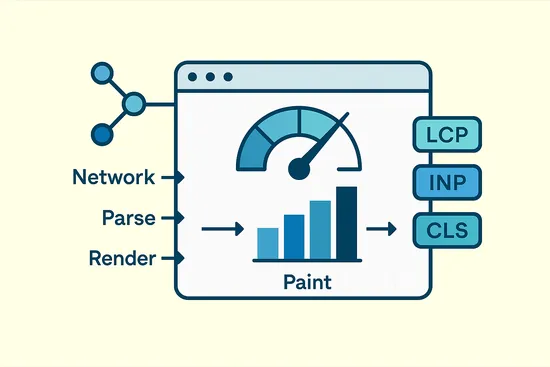
Web performance fundamentals are the backbone of a successful site. They dictate whether your pages load with effortless speed that keeps readers engaged and buyers moving forward—or drag just enough to send them bouncing before you’ve had a chance to make your case.
On mobile networks, low-end devices, or during peak traffic, small delays compound into real money leaks. Search engines also consider real-user performance when deciding how often to crawl and how prominently to surface your pages. In short: speed affects discoverability, usability, and revenue. For teams practicing the fundamentals of web performance, this point is crucial.
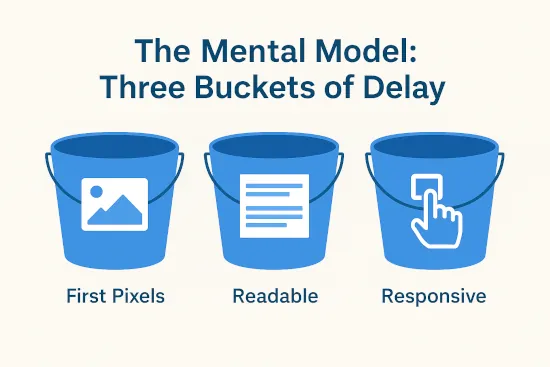
This guide gives you a simple mental model for how the web actually feels fast: first pixels → readable → responsive. We’ll connect that user journey to what the browser is doing under the hood (network, main thread, and render-blocking work) so you can find leverage quickly—without memorizing every API or tool. This reflects core the fundamentals of web performance in everyday builds.
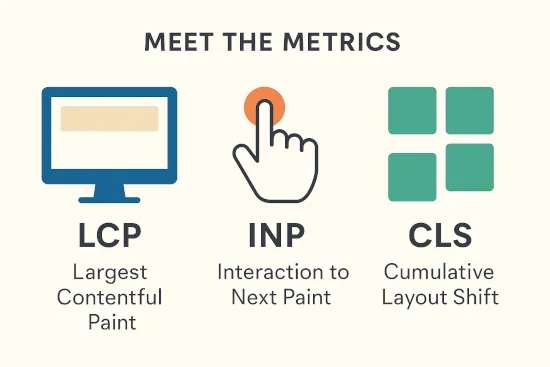
You’ll meet the key metrics—LCP (largest contentful paint), INP (interaction to next paint), and CLS (cumulative layout shift)—but only as signposts that map to visible symptoms and practical fixes. No buzzwords for their own sake; only the parts that help you ship faster pages.
By the end, you’ll be able to:
- Explain, in plain English, how browsers turn HTML/CSS/JS into pixels.
- Read a waterfall and a performance trace well enough to spot the bottleneck.
- Map symptoms to causes and choose high-leverage first fixes (images, fonts, scripts, caching).
- Run a 10-minute diagnostic routine and capture a one-page plan you can act on today.
- Put guardrails in place (budgets and lightweight monitoring) so speed doesn’t regress.
Who this is for: site owners, marketers, and builders—especially WordPress/JS developers—who can open DevTools but want a clear framework for deciding what to fix first. We’ll keep jargon light, show just enough code to be useful, and end every section with actions you can take immediately.
If you’re ready to turn “it feels slow” into a concrete plan, start with the mental model, then follow the diagnostic routine. Pick one fix that moves LCP, INP, or CLS, ship it, and measure again. That’s how you build a persistently fast site.
Table of Contents
Why page speed matters (beyond “it feels faster”)
Speed is not just a “nice to have”—it determines whether users stick around long enough to read, click, or buy. The longer your page takes to become useful and responsive, the more drop-offs you’ll see, especially on mobile and slower networks. Search engines also use real-user performance data to influence crawling and visibility, so poor speed can quietly throttle organic growth. This ties into our broader guide on the fundamentals of web performance.
Think about the user journey in stages: first pixels, content becomes readable, then interactive without jank. Each stage has a clear job: reassure the user they’re in the right place, let them consume content, and finally respond instantly to taps and clicks. Improving any single stage can yield outsized gains—but focusing on the slowest stage (your “bottleneck”) typically produces the biggest wins. This reflects core the fundamentals of web performance in everyday builds.
Kick off with the business case for speed and how it impacts peak events.
Why Site Speed Is the New Black Friday Strategy
Why does speed matter?
The mental model: three buckets of delay

A practical way to approach speed is to break the problem into smaller pieces. Web performance fundamentals show that most slowdowns can be traced back to just a handful of repeatable causes. This makes troubleshooting less overwhelming and more systematic.
By framing issues in buckets, you can quickly connect symptoms to likely sources. Is the holdup in the network, on the main thread, or from resources that block rendering? This structure gives you a map for diagnosis and helps you focus effort where it matters most.
- Network time – The round-trip cost to fetch HTML, CSS, JS, fonts, and images. This includes DNS, TCP/TLS, waiting for the first byte of HTML, and downloading resources. Remedies include caching at the edge, minimizing bytes, and requesting fewer files. This reflects core the fundamentals of web performance in everyday builds.
- Main-thread time – Work the browser must do on your device: parse/compile/execute JavaScript, calculate styles, lay out the page, paint pixels, and compose layers. Remedies include cutting JS, splitting code, simplifying layouts, and avoiding expensive paints.
- Render-blocking – CSS (and sometimes JS) that pauses rendering until it’s loaded or executed. Remedies include inlining critical CSS, deferring non-critical JS, and preloading the single most important asset (often your hero image or font).
Use this model to triage: Is the delay before the first byte (network), while loading or booting code (render-blocking), or during interaction (main thread)? By applying web performance fundamentals, you can map each symptom to the right bucket and choose fixes with confidence.
Use this to frame network vs. server vs. main-thread work.
What is Round Trip Time – RTT vs TTFB vs Latency
Understanding the critical path
Render Pipeline Basics for Web Performance Fundamentals
A modern browser turns code into pixels through a predictable pipeline. Understanding that flow is central to web performance fundamentals. It clarifies what to optimize first and why, giving teams a practical sequence for decisions.
- HTML → DOM: The browser parses your HTML into a Document Object Model tree.
- CSS → CSSOM: Stylesheets are parsed into a structure describing how elements should look.
- Render Tree: DOM and CSSOM merge to produce styled, visible nodes.
- Layout: The browser calculates sizes and positions for each node (this is where big, complex DOMs get costly).
- Paint & Composite: Pixels are drawn to layers and assembled on screen—GPU compositing can help keep this smooth.
Two practical notes. This reflects core web performance fundamentals in everyday builds.
- Reflow & Repaint: Changing layout-affecting properties (like size or font) can trigger re-layout and repaint. Batch your DOM changes; avoid layout thrash in scroll/resize handlers.
- Discovery matters: The earlier the browser discovers your LCP asset (hero image or headline font), the earlier it can show it. That’s why correct markup order and selective preloads are powerful.
A friendly path through parse → style → layout → paint → composite.
How To Fix Forced Reflows And Layout Thrashing
Populating the page: how browsers work
Meet the metrics (map symptoms → fixes)

Performance metrics map directly to user-visible symptoms. Treat them as signposts, not the destination. Mastering web performance fundamentals guides what you fix first. That framing gives teams clear priorities and a defensible plan.
Performance metrics aren’t just abstract numbers—they represent how real users experience your site. By tying each metric to a visible symptom, you can prioritize fixes that have the greatest impact. Instead of chasing perfect scores, focus on the interventions that reduce frustration: faster content appearing on screen, smoother taps and clicks, and layouts that don’t unexpectedly jump around. This practical framing turns web performance fundamentals into tangible wins for both users and business outcomes.
- Largest Contentful Paint (LCP) – When the main content (often a hero image or large heading) becomes visible. Common fixes: ensure the LCP element is in the HTML (not injected late), compress and properly size the image,
preloadthe LCP resource, reduce render-blocking CSS, and lower server wait time. - Interaction to Next Paint (INP) – How quickly the page responds to taps/clicks/keys. Common fixes: reduce long JavaScript tasks, minimize heavy third-party code, chunk work using scheduling, and optimize rendering work triggered by interactions.
- Cumulative Layout Shift (CLS) – Visual stability while content loads. Common fixes: reserve space for images/video/ads, avoid inserting content above existing content, and use sensible font strategies.
- Supporting signals: TTFB (server/edge speed), FCP (first pixels), and TBT/TTI (proxy measures of main-thread block during load). These help pinpoint where time is being lost.
Anchor the brief in Core Web Vitals and what “good” means.
Unlocking Success with 3 Core Web Vitals: LCP, INP & CLS
Understanding Core Web Vitals and Google search results
A 10‑Minute Workflow for Web Performance Fundamentals
Goal: leave with one page of “symptom → suspected cause → testable fix.” Building on web performance fundamentals informs the choices in this section. These fundamentals act like a compass, pointing you toward the most effective solutions instead of quick fixes that don’t last. By keeping the focus on real user impact, you can prioritize optimizations that make the experience genuinely faster and smoother. For teams practicing web performance fundamentals, this point is crucial.
1) Run one external test. Use a lab test (e.g., a public tester) to capture a filmstrip, waterfall, and the top-level metrics. Note the LCP element and whether CLS or INP is problematic. This reflects core web performance fundamentals in everyday builds.
2) Open Chrome DevTools → Performance. Record a page load or a key interaction. Look for:
- Long tasks (spans >50ms) that hog the main thread.
- Scripting vs. rendering time (layout/paint spikes hint at DOM/paint cost).
- Which script or function frames dominate.
3) DevTools → Network. Check:
- TTFB for HTML (slow = origin/caching issue).
- Render-blocking CSS/JS early in the waterfall.
- LCP asset discovery time and size (late discovery or large bytes).
4) Fill the worksheet.
| Symptom | Suspected cause | Validation step | Proposed fix |
|---|---|---|---|
| Slow LCP | Large hero image discovered late | Preload & size check | Compress, add <link rel="preload"> |
| Poor INP | Long tasks from app.js | Performance profile | Code-split; chunk work |
| High CLS | Unreserved ad slots | Layout shift debug | Reserve fixed slot size |
A quick, reliable way to go from “something’s slow” to likely cause.
Learnings From a WebPageTest Session on CSS-Tricks
How to Read a Request Waterfall Chart
Quick wins that help most sites
Images
- Use modern formats (e.g., AVIF/WebP) and correct
sizes/srcsetso mobile devices don’t download desktop images. - Lazy-load below-the-fold images; keep the LCP image eager.
- Compress aggressively; audit largest images first.
Fonts
- Subset to the characters you need.
- Prefer
font-display: swaporoptionalto avoid blocking rendering. - Preload only the single font file needed for your LCP text.
- Consider font metric overrides to keep fallbacks from shifting layout.
<!-- Preconnect to your font host and preload the LCP font -->
<link rel="preconnect" href="https://fonts.example.com" crossorigin>
<link rel="preload" as="font" href="/fonts/Inter-roman.var.woff2" type="font/woff2" crossorigin>
@font-face{
  font-family: "Inter";
  src: url("/fonts/Inter-roman.var.woff2") format("woff2");
  font-display: swap;
  /* Optional: tweak metrics to reduce shift */
  ascent-override: 90%; descent-override: 10%; line-gap-override: 0%;
}
Third-party scripts
- Remove anything unused; defer the rest.
- Load marketing/analytics after user interaction or on consent.
- Consider offloading non-critical scripts to a worker-based approach.
Caching & delivery
- Serve HTML from the edge for anonymous traffic when possible.
- Set long cache lifetimes for static assets; fingerprint filenames.
- Enable HTTP/3 and Brotli; keep TLS fast and certificates fresh.
Critical CSS & hints
- Inline above-the-fold CSS (just enough to render the shell).
- Use
preconnect/dns-prefetchto shorten first requests. preloadyour LCP image or font—one well-chosen preload beats five guesses.
This section highlights web performance fundamentals. Use it to align your team on what to improve first.
Start with images: biggest bytes, fastest wins.
How to Improve Image Delivery on Your Website
Image performance
Reading a waterfall like a pro

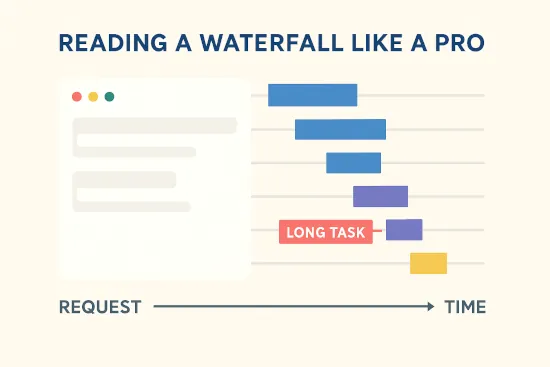
A request waterfall can look intimidating at first—dozens or even hundreds of lines, each with colored bars and timing details. But once you know what to look for, it becomes a powerful story of how your page loads, revealing where time is spent and which requests hold everything else back.
- Find the LCP element—image or text. Trace its path: DNS → connect/TLS → TTFB → download. Ask whether it’s discovered early and sized appropriately. Applying web performance fundamentals helps you choose what to fix first.
- Spot render blockers. Early CSS/JS requests that block first pixels are prime targets. Combine/minify isn’t a silver bullet—remove or defer what’s not needed. This reflects core web performance fundamentals in everyday builds.
- Look for stairs. Sequential chains (HTML → render-blocking CSS → render-blocking JS → image) show dependency problems. Aim for earlier discovery and parallelization.
- Check origin time. A slow HTML TTFB suggests missed caching or heavy server work; try edge caching and lighter templates.
- Third-party impact. Late-arriving pixels from tags can delay LCP or cause CLS. Load later, or isolate their impact.
Red flags: dozens of tiny JS files, fonts loaded after text appears, duplicated CSS, and images loading without width/height (or CSS aspect ratio) reservations.
Turn the waterfall into a story about cause and effect.
Does Making Fewer HTTP Requests Improve Page Speed?
Reading a WebPageTest Waterfall Chart
JavaScript cost and interaction jank
Heavy JavaScript steals time during load and on every interaction. Focus on three tactics: ship less code, break up long tasks, and defer non-critical work. Implementing web performance fundamentals guides these choices and keeps interactions smooth.
- Ship less JS. Remove unused code and third-party widgets. Split bundles by route and defer non-critical features. This reflects core web performance fundamentals in everyday builds.
- Shorten long tasks. Any task over ~50ms can hurt responsiveness. Break work into smaller chunks and schedule it when the main thread is idle.
- Render efficiently. Avoid layout thrash (reading layout metrics and writing styles in the same frame) and expensive paint effects.
Chunk a long task example:
// Instead of blocking for 300ms, process in small pieces
function processItems(items) {
  const CHUNK = 50;
  function next(i) {
    const end = Math.min(i + CHUNK, items.length);
    for (let j = i; j < end; j++) doWork(items[j]);
    if (end < items.length) {
      requestIdleCallback(() => next(end), { timeout: 200 });
    }
  }
  next(0);
}
Measure → fix → re-measure: record an interaction in DevTools, identify the long task/function, apply chunking or memoization, and re-record to verify the INP improvement.
Trim, defer, and break up long tasks to protect INP.
Partytown: Optimize Third Party Scripts with Web Workers
Optimize long tasks
Make it stick: budgets & guardrails
Performance regresses unless you set boundaries and monitor them. Establish budgets for LCP/INP/CLS and total JS, enforce them in CI and reviews, and watch p75 in RUM. Mastering web performance fundamentals helps you choose limits that stick.
- Define budgets: Pick a few constraints that matter: LCP/INP/CLS targets, total JS (gzip/transfer), and number of blocking resources.
- Automate checks: Run a lab test in CI on key templates and fail the build when budgets are exceeded. Keep the config visible in the repo.
- Track real users: Add lightweight RUM to watch percentiles (p75 is common) and segment by country/device. Investigate regressions quickly.
- Freeze before launches: Pause script changes before big campaigns, warm caches, and put synthetic monitors on the home, product, and checkout pages.
- Create an “allowlist” for third parties: New tags require an owner, a purpose, and a measurable benefit.
Start small: one budget for JS size, one for LCP, one for CLS. Tighten after you’ve harvested the obvious wins. This reflects core web performance fundamentals in everyday builds.
Prevent regressions with clear, enforced limits.
Getting Into Performance Budgets
Performance budgets 101
TL;DR checklist
- Identify your LCP element and make it small, early, and cacheable.
- Inline just enough critical CSS; defer or remove non-critical JS.
- Preload one asset that unlocks the first meaningful pixels (image or font).
- Use responsive images with correct
sizes/srcset; lazy-load the rest. - Subset fonts, use
font-display: swap/optional, and reserve space to avoid shifts. - Trim or delay third-party tags; load them after interaction or on consent.
- Cache HTML at the edge for anonymous users; fingerprint and cache static assets long-term.
- Enable HTTP/3 and Brotli; keep TLS/connection reuse healthy.
- Profile with DevTools: eliminate long tasks and layout thrash that hurt INP.
- Set budgets in CI and watch p75 real-user data over time.
This section reinforces web performance fundamentals and clarifies next steps. For teams putting these practices into play, the guidance is crucial.
Glossary (newcomer-friendly)
- Critical Rendering Path – The minimum set of steps and resources needed to render the first meaningful pixels.
- TTFB (Time to First Byte) – How long the server/edge takes to start sending HTML.
- FCP (First Contentful Paint) – When the first bit of content (text or image) appears.
- LCP (Largest Contentful Paint) – When the main content becomes visible.
- INP (Interaction to Next Paint) – How fast the page responds to user input.
- CLS (Cumulative Layout Shift) – A measure of unexpected layout movement during load.
- Long task – A main-thread task that runs long enough to block input from feeling instant.
- Render-blocking resource – CSS/JS that delays first pixels or interactivity.
- Waterfall – A timeline of network requests and their phases (DNS, connect, TTFB, download).
- Filmstrip – A frame-by-frame view of what the user sees over time.
This section anchors the work in web performance fundamentals and points to concrete actions. For teams applying these ideas, the guidance is essential.
Call to action
You now have a mental model, a 10-minute diagnostic routine, and a set of quick wins. All of this fits within web performance fundamentals, providing a foundation you can apply immediately to make your site faster and more resilient. The next step is simple: put these practices into motion and measure the difference they create.
- Run a fresh test on your homepage or a key landing page.
- Fill the worksheet with one suspected cause and one fix.
- Ship the smallest change that improves either LCP, INP, or CLS—then measure again.
Next up on Optimize the Web: deep dives on images, fonts, JavaScript/INP, reading waterfalls, and setting performance budgets in CI. Subscribe for the step-by-step guides.